
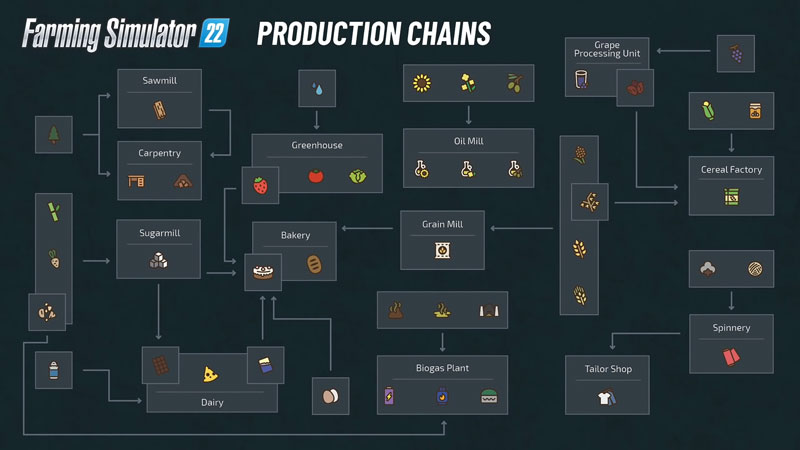
FS22 brings with it a new and improvised Production Chains Chart that will change your Farming Simulator experience. Production Charts are basically flowcharts that show how all your resources can be utilized and turned into profit. It is a helpful visual guide that will help you plan your output and earn higher profits. So, scroll down and have a look at the Farming Simulator 22 Production Flowchart.
FS22 Production Chains Chart
| OIL MILL | IN QTY | PRICE/L | OUTPUT | OUT QTY | PRICE/L | END VALUE |
| Canola | 200 | 0.603 | Canola Oil | 100 | 1.35 | 112% |
| Sunflower | 200 | 0.673 | Sunflower Oil | 100 | 1.35 | 100% |
| Olive | 100 | 0.603 | Olive Oil | 50 | 2.4 | 199% |
| GRAIN MILL | IN QTY | PRICE/L | OUTPUT | OUT QTY | PRICE/L | END VALUE |
| Wheat | 150 | 0.337 | Flour | 120 | 0.5 | 119% |
| Barley | 150 | 0.313 | Flour | 113 | 0.5 | 120% |
| Oat | 150 | 0.532 | Flour | 188 | 0.5 | 118% |
| Sorghum | 150 | 0.43 | Flour | 158 | 0.5 | 122% |
| CEREAL FACTORY | IN QTY | PRICE/L | OUTPUT | OUT QTY | PRICE/L | END VALUE |
| Honey | 30 | 1 | Cereal | 60 | 2.35 | 111% |
| Raisins | 30 | 1.4 | ||||
| Oat | 60 | 0.532 | ||||
| Corn | 60 | 0.38 | ||||
| BAKERY | IN QTY | PRICE/L | OUTPUT | OUT QTY | PRICE/L | END VALUE |
| Flour | 90 | 0.5 | Bread | 45 | 1.4 | 140% |
| Flour | 8 | 0.5 | Cake | 20 | 3.3 | 190% |
| Sugar | 8 | 0.5 | ||||
| Milk | 8 | 0.7 | ||||
| Egg | 8 | 1.5 | ||||
| Butter | 8 | 0.9 | ||||
| Strawberry | 8 | 0.25 | ||||
| CARPENTRY | IN QTY | PRICE/L | OUTPUT | OUT QTY | PRICE/L | END VALUE |
| Wood | 60 | 1 | Boards | 80 | 1.3 | 174% |
| Woodchips | 3 | 0.08 | ||||
| Wood | 36 | 1 | Furniture | 45 | 2 | 250% |
| Woodchips | 1.2 | 0.08 | ||||
| Boards | 50 | 1.3 | Furniture | 70 | 2 | 215% |
| Woodchips | 0.9 | 0.08 | ||||
| DAIRY | IN QTY | PRICE/L | OUTPUT | OUT QTY | PRICE/L | END VALUE |
| Milk | 150 | 0.7 | Butter | 130 | 0.9 | 111% |
| Milk | 75 | 0.7 | Cheese | 50 | 1.8 | 171% |
| Milk | 50 | 0.7 | Chocolate | 50 | 2 | 167% |
| Sugar | 50 | 0.5 | ||||
| SPINNERY | IN QTY | PRICE/L | OUTPUT | OUT QTY | PRICE/L | END VALUE |
| Wool | 60 | 0.6 | Fabric | 30 | 3 | 250% |
| Cotton | 60 | 1.252 | Fabric | 36 | 3 | 144% |
| SUGAR MILL | IN QTY | PRICE/L | OUTPUT | OUT QTY | PRICE/L | END VALUE |
| Sugarbeet | 500 | 0.122 | Sugar | 250 | 0.5 | 205% |
| Sugarbeet Cut | 500 | 0.172 | Sugar | 300 | 0.5 | 174% |
| Sugarcane | 500 | 0.119 | Sugar | 250 | 0.5 | 210% |
| TAILOR SHOP | IN QTY | PRICE/L | OUTPUT | OUT QTY | PRICE/L | END VALUE |
| Fabric | 90 | 3 | Clothes | 45 | 8 | 133% |
| GRAPE PROCESSING UNIT | IN QTY | PRICE/L | OUTPUT | OUT QTY | PRICE/L | END VALUE |
| Grape | 90 | 0.603 | Raisins | 90 | 1.4 | 232% |
| Grape | 90 | 0.603 | Grapejuice | 72 | 1.6 | 212% |
Also Read: Farming Simulator 22 Trophy Guide: How To Get All The Trophies?
This is the complete FS22 Production Chains Chart. However, do remember that this is based on perfect conditions in the game. It also makes calculations based on base prices of items. This doesn’t take into account the cost of equipment, land, time, monthly price fluctuations, or style of farming. It also doesn’t take into account any other additional production costs. What this chart does is calculate the value of the inputs and the outputs. Then it generates the “bonus” that the process yields.
This list is just an indication of potential profits and output margins that you can get for yourself. So, you have an idea of what to expect from your potential input quantity.
Thanks to Redditor u/haeriphos for finding and making this chart based on the game files. He managed to enter in the raw details from game files and come up with a proper output yield. But again, this is based on perfect conditions and doesn’t take into account other costs.
This is everything that you need to know about the FS22 Production Chains Chart. While you are here, make sure to have a look at the Farming Simulator 22 Money Cheat and How To Fix Farming Simulator 22 Multiplayer Not Working.